
Другие материалы


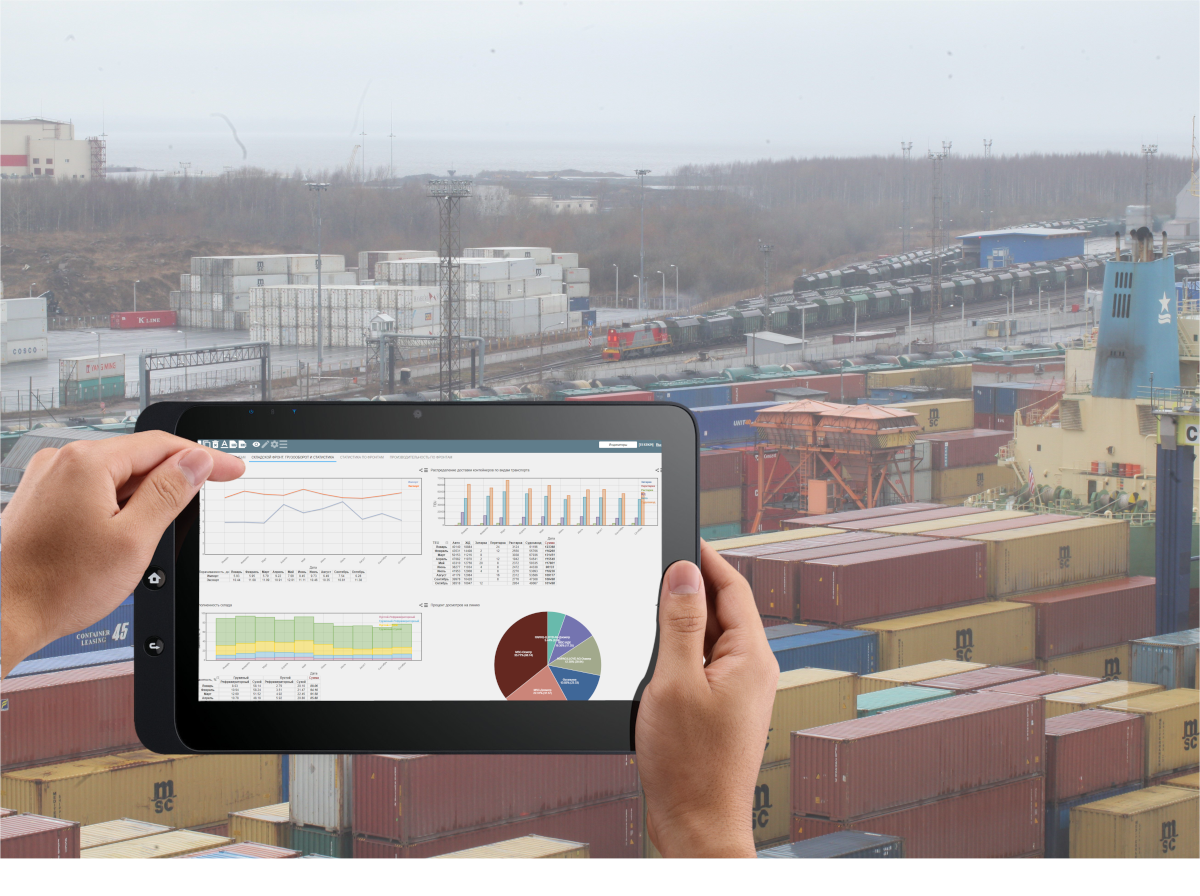
The Solvo.KPI module now helps Container Terminal Saint Petersburg (CTSP) – currently the largest Russian container handling facility in terms of throughput – to be in full control of their operational performance through a KPI dashboard toolkit incorporating 54 different metrics. It works as an add-on module to Solvo.TOS – a comprehensive terminal operating system running at CTSP. The module has been adapted specifically for the business processes of this terminal.
The Solvo.TOS system has been successfully operating at the CTSP for over 10 years now. SOLVO and CTSP together have cooperated in a large number of projects over the years such as the implementation of an automated reefer container monitoring system, which consists of equipment and software from Emerson Refcon, integrated with Solvo.TOS; deployment of an electronic truck driver queue at the terminal checkpoint and much more.
This time, the CTSP management set the task to organize regular automated monitoring of the terminal using key performance indicators and thus improve decision-making process.
The Solvo.KPI module connects to Solvo.TOS and does not require any additional integrations into the existing infrastructure or extra maintenance costs. Also, one of the advantages of working with the SOLVO team is the ability to deeply customize the basic functionality of the product for the customer's goals, which was done in this case. Many of the main functions of the module have been significantly redesigned as part of the implementation project.
The terminal's efficiency is measured against vessel, truck and gate, yard, CFS and railway fronts.

All KPI's can be divided into several groups:
general indicators (total cargo turnover, terminal turnover, etc.);
Metrics for KPIs were developed based on the experience of leading European companies. SOLVO specialists note that it was a tremendous effort to systematize all the data and adopt the module to the requirements of the terminal.
“We are ready to add indicators and change algorithms for calculating those available at the request of our clients,” – the SOLVO project support service notes.

Cargo turnover
Vessel Measurements
Number of Vessel calls
and other indicators

Cargo turnover
Number of railcars
Railway front workload
and other indicators

Cargo turnover
Number of trucks
Trucks per Gate per Hour
and other indicators

Dwell Time in Yard
Yard Measurements
Yard Productivity
Yard Equipment Productivity
and other indicators

Number of lifts per crane operating hour
Number of crane movements
Working hours of equipment (truckload/empty)
and other indicators

Number of containers loaded by a particular worker
Number of lifts per quay/yard laborer hour
List of the best workers for the period
and other indicators
Solvo.KPI module will help effectively prepare and successfully pass audits and other quality checks of the terminal.
Users have a wide range of customization options. For example, you can:
create custom dashboards and make calculations from the indicators available in the database;
Solvo.KPI is available for all Solvo.TOS users regardless the version they are currently using. Pre-orders can be made directly through the website or your local Solvo.TOS distributor.